Forecasting the Unpredictable: Making Sense of Nonlinear, Nonstationary Data
Every organisation that records data eventually wants to look forward. A facilities team watches sensor readings and asks what next month will bring. A planner studies demand and wants to know where it is heading. An operator monitors a structure, a process, or a market and needs an early signal before a problem becomes a cost. The promise of forecasting is simple: use what has already happened to anticipate what comes next.
The difficulty is that most real-world data refuses to behave. It does not follow a tidy straight line, and its character keeps changing over time. Patterns that held last quarter quietly stop working this quarter. This is the world of nonlinear, nonstationary data, and it is exactly where conventional forecasting tends to fall apart. At ESG (Engineering Support Group), turning this kind of difficult, recorded data into reliable forecasts is part of our core work, and it is worth explaining why the problem is hard and what a trustworthy answer actually looks like.
What makes data nonlinear and nonstationary
Two words do most of the heavy lifting here, so it helps to define them plainly.
Nonlinear means cause and effect are not proportional. Double the input and you do not simply get double the output. Think of traffic on a road: add a few cars to a quiet motorway and nothing much happens, but add the same few cars near capacity and the whole flow can collapse into a jam. Small changes can have outsized effects, and the relationship between yesterday and tomorrow is not a fixed multiplier.
Nonstationary means the rules of the game drift over time. The average level moves, the size of the swings grows or shrinks, and the rhythm of the ups and downs shifts. A useful analogy is the weather across seasons: the typical temperature, the daily range, and the pattern of variation in July are simply not the same as in January. A model that learned the behaviour of one period can be quietly wrong in the next.
Most data that matters to engineers and decision-makers is both at once. Readings carry long, slow trends, faster cycles riding on top of them, sudden shocks, and a layer of noise that hides the signal underneath. The result looks messy because it genuinely is.
Why standard forecasting falls short
The most familiar forecasting tools were built on convenient assumptions: that relationships are roughly linear and that the underlying behaviour stays put. A simple trend line, or a classic statistical model, fits the data it was given and then extends that fitted shape into the future.
This works beautifully when the assumptions hold. It fails quietly when they do not. Three failure modes are common. First, a linear model averages away the very nonlinearity that drives the interesting behaviour, so it misses turning points and underestimates extremes. Second, a model trained on a stationary view keeps projecting yesterday’s regime even after the data has moved on, so its forecasts drift further from reality the longer they run. Third, raw noise gets mistaken for signal, and the forecast either chases random wiggles or smooths over real structure.
The honest summary is that a single, simple model is being asked to do too many jobs at once. It is trying to capture slow trends, fast cycles, sudden shifts, and noise with one set of rules. Difficult data needs a more thoughtful approach.
A smarter approach: separate, learn, recombine
The key idea behind ESG’s methodology is that a tangled signal becomes far more predictable once you stop treating it as a single thing.
Instead of forcing one model onto the whole mess, we separate the recorded signal into a small set of simpler underlying components. Each component is calmer and better behaved than the original: one might carry the slow background trend, another a steady cycle, another the faster fluctuations. On their own, these pieces are far easier to understand and to project forward, because each one behaves in a more consistent way.
We then let machine learning study each component in turn. Machine learning is well suited to this because it can capture the nonlinear, shifting relationships that defeat a straight line, learning the actual behaviour from the data rather than assuming a fixed formula in advance. Finally, the individual forecasts are recombined into a single prediction for the original quantity.
The intuition is the same one a good analyst uses instinctively: break a complicated problem into parts you can reason about, solve each part well, then put the answer back together. Doing this rigorously, and at scale, is where the engineering lies. We keep the specifics of our pipeline in-house, but the principle is straightforward to grasp: separate, learn, recombine.
What a trustworthy forecast looks like
A forecast is only worth having if you can trust it, and trust has to be earned with evidence, not asserted.
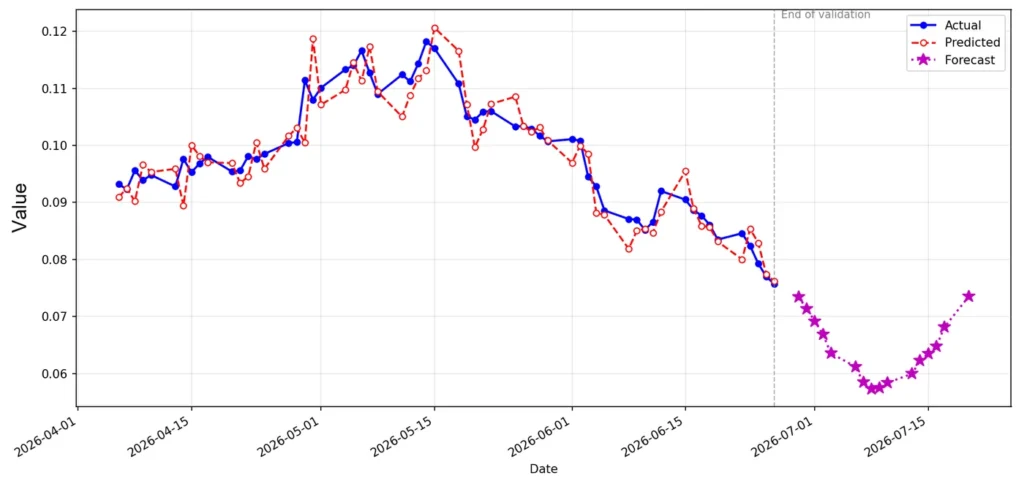
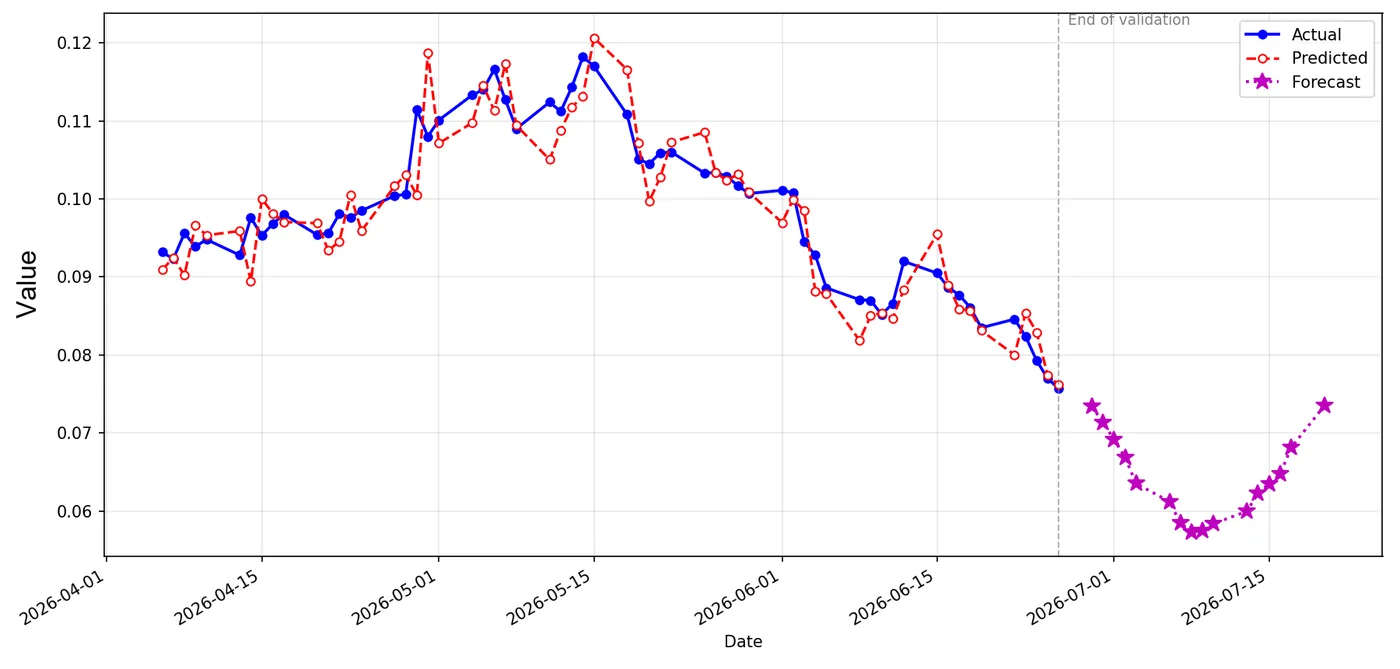
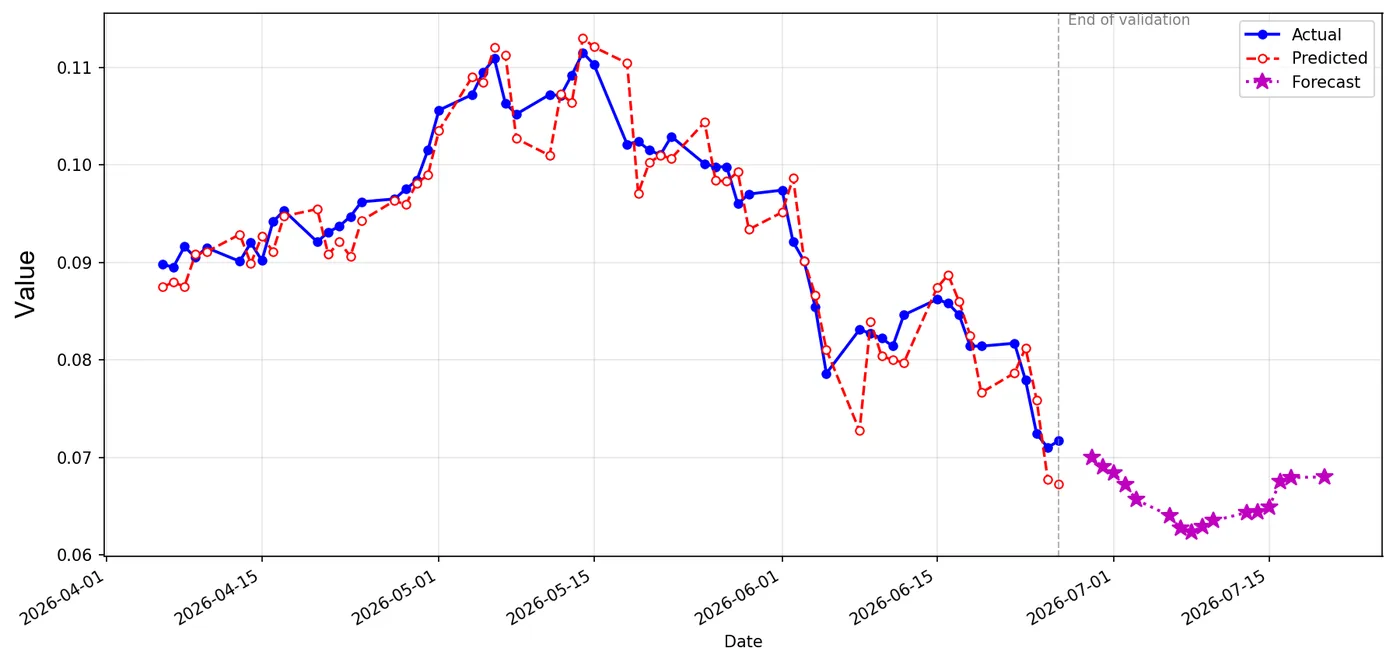
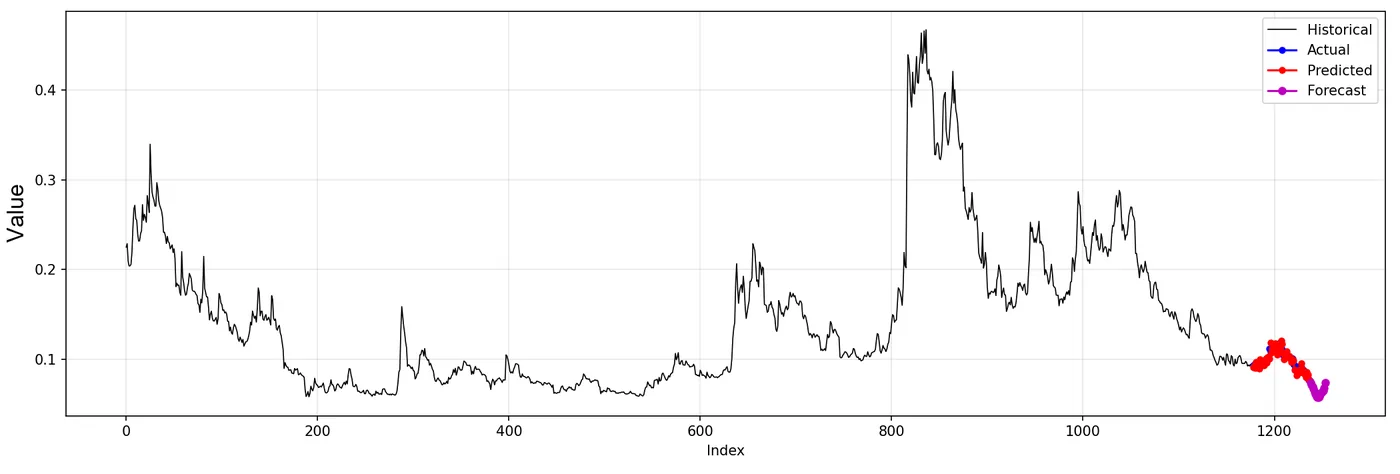
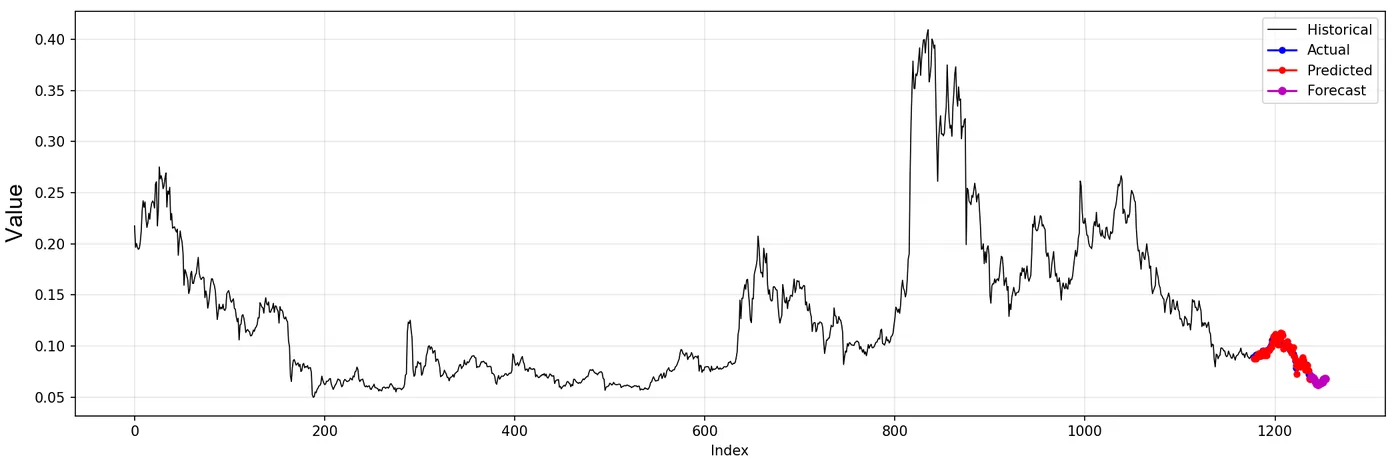
The first test is validation. Before projecting into the unknown, we hold back a recent stretch of data that the model never sees during training, then ask it to predict that stretch and compare its predictions against the values we actually recorded. This is an honest exam: the answers already exist, so there is nowhere to hide.
In a well-built model, the predicted line tracks the real one closely through the validation window, following the rises and falls and catching the turning points where the direction changes. That is the behaviour that matters most for decisions, because knowing which way something is about to move, and roughly when, is often more valuable than pinning an exact number.
It is just as important to be candid about the limits. Even a strong model tends to understate the very sharpest peaks and the deepest troughs, smoothing the most violent moves a little. And every forecast becomes less certain the further ahead it reaches: a few steps out is firm ground, while a long horizon is an informed projection, not a guarantee. Any forecaster who claims otherwise is overselling. We would rather give you a clear-eyed view of both the signal and its uncertainty.
Where this applies
Because the approach works on the shape of the data rather than its subject, it transfers across very different fields. The method is well suited to any recorded signal that is nonlinear and nonstationary, including:
- structural and condition-monitoring sensor data (vibration, strain, displacement, settlement)
- environmental and climate records
- energy generation, consumption, and load profiles
- operational and process measurements from plants and equipment
- demand, throughput, and other business time series
If a quantity is measured repeatedly over time and behaves in a complicated, shifting way, it is a candidate.
Why it matters for decision-makers
Reliable foresight changes how an organisation acts. The value is practical:
- Earlier warning. Spotting an emerging trend or turning point sooner gives time to respond before a small issue becomes an expensive one.
- Better planning. Forecasts grounded in real behaviour support more confident decisions on maintenance, capacity, and resourcing.
- Reduced risk. A clear view of likely outcomes, together with an honest sense of the uncertainty around them, leads to safer and more defensible choices.
- More from existing data. Much of the value is already sitting in records you collect today; the right analysis simply unlocks it.
Turning your data into foresight
Difficult data is not a reason to settle for guesswork. Nonlinear, nonstationary signals can be forecast well, provided the analysis respects how messy the data really is and stays honest about what it can and cannot promise. That combination, rigour with candour, is what makes a forecast something you can actually plan around.
If your organisation records data that is hard to predict, ESG can help you turn it into reliable forecasts and earlier, better-informed decisions. Get in touch to discuss your data and what it could tell you about the months ahead.