From Frequency Shifts to Predictive Signatures: A Smarter Way to Monitor Bridge Health

Bridges across the region are exposed to a punishing combination of heavy traffic, seismic activity, temperature extremes, humidity, and chloride-laden air. Detecting the slow, hidden deterioration of these structures before it becomes critical is one of the most valuable, and most difficult, problems in civil engineering.
For more than two decades, dynamic testing has been the principal non-destructive tool for the job. The logic is elegant: a structure’s natural frequencies and mode shapes are a direct fingerprint of its mass and stiffness. As the structure deteriorates, stiffness drops, frequencies shift, and mode shapes deform. Compare today’s signature with a baseline and, in principle, you see damage before it becomes visible.
In practice, it has never been that simple.
The Limits of the Classical Approach
Earlier research presented at the First Middle East Conference on Smart Monitoring (SMAR 2011, Dubai), co-authored by a member of our team, examined three medium- and long-span concrete box-girder bridges with span lengths between 23 m and 150 m. Three findings from that study still hold today:
- Ambient excitation (traffic and wind) is the only practical way to excite long-span bridges. Shakers, impact rigs, and step-relaxation tests are not deployable at scale on operational assets.
- Mode-shape comparison (via the Modal Assurance Criterion, MAC) is more robust than frequency shifts alone. A MAC value below 0.90 is a strong damage signal; frequency shifts on their own can mislead.
- Environmental noise creates 5–10% baseline variance in measured frequencies. Temperature, humidity, wind, and traffic state drive natural fluctuations that mask early-stage damage. The published threshold for reliably detectable damage was a 1.5% frequency shift, but only after rigorous filtering of environmental effects.
The third point is the rub. The signal-to-noise problem is real, and classical statistical filtering only goes so far.
Why Bridge Data Is Hard
Filtering struggles because bridge response data is inherently non-linear and non-stationary:
- Non-linear: stiffness changes with strain level, soil-structure interaction, and temperature in ways that are not proportional to input.
- Non-stationary: the statistical properties of the signal (mean, variance, dominant frequencies) shift with time of day, weather, traffic intensity, and season.
Classical signal-processing tools (Fourier analysis, linear regression, fixed-threshold change detection) assume the opposite. Applied to bridge data they leak energy across frequencies, smear damage signatures, and produce false alarms.
A different class of tools is needed.
An Adaptive, Non-Linear, Non-Stationary Forecasting Approach
At ESG we have been developing and validating an in-house Python-based analytical workflow built specifically for non-linear, non-stationary signals. The principle is simple but powerful:
Instead of comparing measurements against a fixed threshold, train a model to forecast the expected response under current environmental and operational conditions, and flag the residuals.
If the model has learned the bridge’s baseline behaviour across the full range of environmental states, a healthy structure produces residuals tightly clustered around zero. A damaged structure produces a systematic, persistent deviation, even when the absolute response value still falls within the historical range.
The key advantage: environmental variation no longer needs to be filtered out. The model absorbs it as part of the baseline.
Validation
Recent validation runs show the workflow is working as intended. Across multi-year time series, per-iteration forecasts track actual measurements closely. The forecast error distribution is sharp and centred: the bulk of errors fall within ±3.0%, with the histogram tightly clustered around zero. There is no systematic over- or under-prediction across the period under test, meaning the model is not introducing bias of its own.
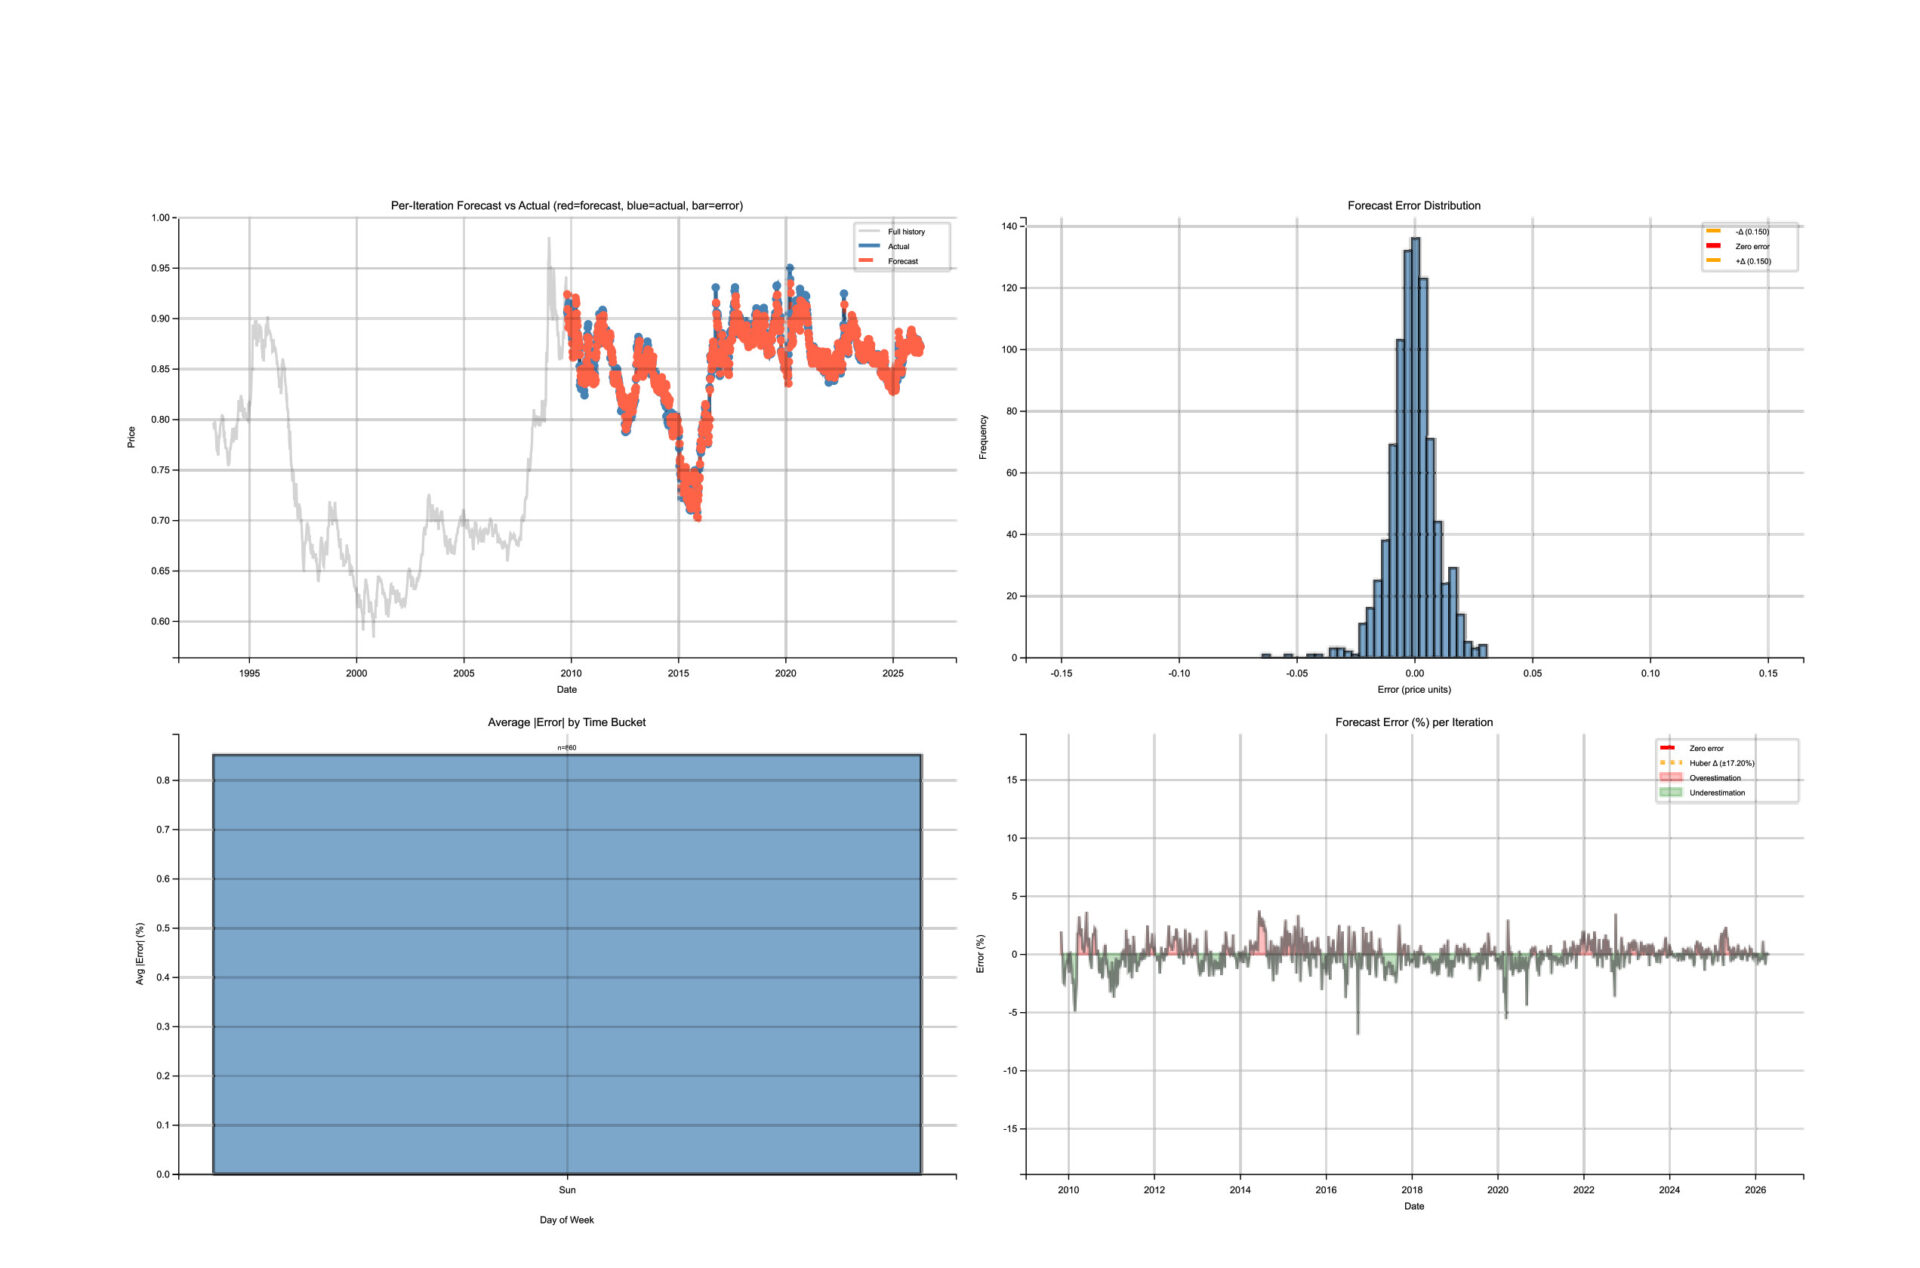
That sharpness matters. The narrower the residual distribution under healthy conditions, the smaller the damage signal we can reliably detect, and the earlier we can intervene.
What This Means for Asset Owners
Translated to operational structural health monitoring, this approach unlocks three practical capabilities:
- Earlier detection. Damage producing a 1–2% deviation (previously below the noise floor) becomes detectable when environmental variance is absorbed by the model rather than treated as noise.
- Lower false-alarm rates. Seasonal and weather-related fluctuations no longer trigger investigations, reducing inspection cost and operator fatigue.
- Condition-based maintenance. With a calibrated forecast model and continuous sensor streams, asset owners move from periodic, calendar-driven inspections to risk-prioritised interventions when the data justifies them.
The Road Ahead
Bridge engineering in the region has matured rapidly, and as the asset base ages and traffic loads keep climbing, monitoring will shift from optional to obligatory.
Combining classical modal testing (accepted by every authority) with non-linear, non-stationary forecasting brings the best of both worlds: the rigour of established methods, plus the sensitivity and adaptiveness needed to detect damage before it becomes visible.
In our view, this is the future of bridge health monitoring.
Engineering Support Group (ESG) is a specialist infrastructure engineering consultancy based in Sharjah, UAE, delivering civil and structural engineering, bridge design, structural health monitoring, and asset management services across the Gulf. To discuss SHM for a specific asset, contact info@esg2018.com or visit esg2018.com/structural-health-monitoring.
For a structured overview of the field, see our complete guide to structural health monitoring.